TDF 162 kHz antenna test, February 2020
Pieter-Tjerk de Boer, PA3FWM web@pa3fwm.nlFrom January 7 till February 4 2020, the ANFR (Agence nationale des fréquences) did a test with their 162 kHz transmitter, running it at 800 instead of 1100 kW, and from January 21 on their backup antenna; see https://www.anfr.fr/toutes-les-actualites/actualites/optimisation-des-parametres-de-diffusion-du-signal-horaire-1/. Nowadays, this transmitter only transmits a timecode; see here.
The 1.38 dB reduction of amplitude is hard to see amidst other fluctuations; see here. However, the change of antenna may introduce a phase shift, so I ran a phase measurement during the last week of this test. This was an improvised setup, so the results are not very accuratet; The reference was not an atomic clock or GPS signal, but the LORAN-C signal from Anthorn (UK) received with the same receiver and antenna (the WebSDR at the University of Twente, Enschede, The Netherlands).
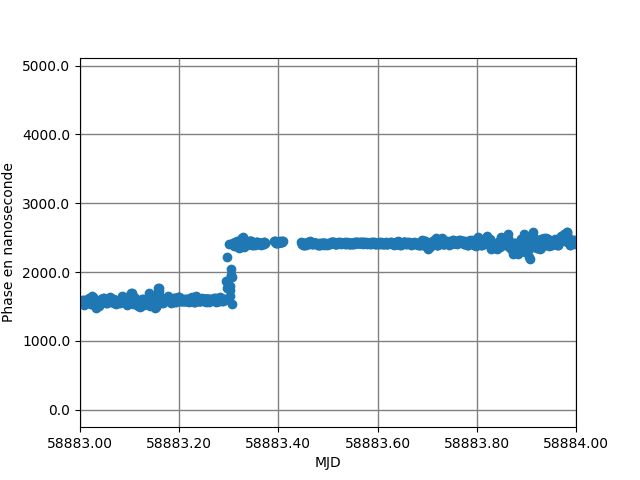
The following graph shows the measured (relative) phase over the last week:
![[received signal phase from February 1 till 7]](162-01.png)
Despite the many fluctuations (which are at least partially due to the improvised
measurement setup), a clear phase advance of about 60 degrees is visible around 07:30 UTC on February 4th.
Actually, I didn't expect to see such a clear phase change.
They switched from their southern mast to their northern mast.
Judging by the
aerial view on Google maps,
the transmitter building is near the southern mast, and there is a feedline to the northern mast.
Thus, the signal arrives with a delay at the northern mast.
The masts are about 460 m apart, corresponding to 1.5 µs at the speed of light, or a quarter wavelength
at 162 kHz, or 90 degrees of phase.
On the other hand, my receiver is north-north-east of the transmitter site, so the northern mast is closer
to my receiver, which should largely cancel the delay from the feed line, leaving a net extra delay
of near zero.
Then again, besides the geometry and the phase line,
their may be other factors, like matching networks which could cause additional phase changes
that we can't conclude from this aerial view.
Let's zoom in on the morning of February 4, and also include the amplitude:
![[received signal phase and amplitude on February 4]](162-02.png)
We see the transmitter was switched off briefly a couple of times around 07:05 and 07:15, and apparently
some 5 dB power change tests were done; and then it was switched off for two longer intervals starting at 09:00 and
at 09:50, presumably for their regular Tuesday maintenance.
Since the phase already changes before the 09:00 switchoff, presumably the antenna was switched in
one of the earlier interruptions.
I had expected any phase jump to occur suddenly, at the moment the antenna was switched. A sudden big jump should be quite visible, even in the presence of measurement inaccuracies. However, no big jump is visible. Around the 07:05 switch off, the phase seems to have advance by only about 15 degrees, but the remaining 45 degrees of phase change seem to have been a gradual change, possibly even with an overshoot around 07:40.
One possible explanation is that there is a control loop at work here. Perhaps they monitor the phase at some remote location, compare it to an atomic clock reference there, and slowly steer the transmitter to have the right phase at that location. If said monitoring receiver is in a different direction from the transmitter than my receiver, so experiencing a different phase change due to the antenna change, it could explain the above pattern.
If a reader of this page has more details of how this transmitter is operated and locked to an atomic clock, I'd be much interested in hearing about it!
Update January 2026
According to page 123 of https://syrte.obspm.fr/spip/IMG/pdf/bulletin_bnm_no63-64_p120_1986.pdf, there is indeed a control loop for the phase, using apparently a local antenna and a local cesium clock at the transmission site. That text however suggests a much faster update (180 degrees in 12 seconds) than I have observed. So this may be (partially?) outdated.Also, SYRTE monitors the phase of the signal as received in (presumably) Paris. The results are published here. Historical data from February 4, 2020, is here, and clearly shows a phase jump of about 50 degrees. So if there's a control loop for the phase, it does not go via SYRTE/Paris.