Selective fading on longwave
Pieter-Tjerk de Boer, PA3FWM web@pa3fwm.nl(This is an adapted version of part of an article I wrote for the Dutch amateur radio magazine Electron, May 2019.)
Some readers of my article about sideband asymmetry in the Luxembourg effect [9] noticed that Europe1 on 183 kHz also seems to have asymmetric sidebands, and asked me whether this has the same cause. That is not the case. The sideband asymmetry described in [9] can only occur in cross-modulation of two signals in the ionosphere, while here the asymmetry is seen in Europe1's own sidebands.
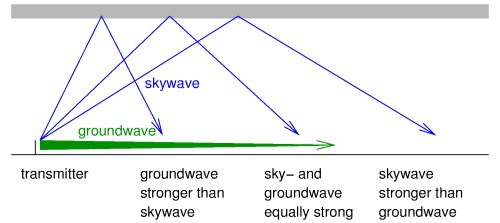 The asymmetry we see on Europe1 (and many other stations), is usually a consequence of
receiving the signal via (at least) two paths, e.g. groundwave and skywave as shown the figure.
On some frequencies the path length difference is such that both waves arrive in opposite phase
and thus cancel each other.
That gives a dip in the spectrum at such a frequency.
The asymmetry we see on Europe1 (and many other stations), is usually a consequence of
receiving the signal via (at least) two paths, e.g. groundwave and skywave as shown the figure.
On some frequencies the path length difference is such that both waves arrive in opposite phase
and thus cancel each other.
That gives a dip in the spectrum at such a frequency.
Let's calculate this for the case of receiving Europe1 in Enschede (Twente WebSDR). The Europe1 transmitter is located in the Saarland, some 330 km from Enschede. This is the distance the groundwave must travel, which, at the speed of light, takes 1.1 ms. The skywave is mostly reflected by the E layer, at a height of about 90 km. This detour takes 1.26 ms; so the skywave takes 0.16 ms more than the groundwave.
To get a dip in the spectrum, there must be 180 degrees of phase difference between both paths (groundwave and skywave). That happens if "an integer number plus half" periods fit in those 0.16 ms; that half period extra results in opposite phase. For example 28½ periods in 0.16 ms, that is 28.5/0.16 = 178.1 kHz; or 29½ periods, giving 184.4 kHz; or 30½ periods for 190.6 kHz. More generally: we get dips at 1/0.16 = 6.25 kHz spacing.
But that 0.16 ms is not known so precisely: it depends e.g. on the height of the ionosphere. If the difference between both paths would not be 0.160 but 0.161 ms, then the 184.4 kHz dip already moves to 183.2 kHz. And the ionosphere is in motion, so this is going to vary all the time. The distance between the dips does remain about 6 kHz. So what we get is a set of dips, spaced at about 6 kHz, drifting together back and forth as the ionosphere changes.
This explains the asymmetric sidebands: it is quite possible that there is a dip at e.g. 184 kHz but not at 182 kHz, so the sidebands around the 183 kHz carrier are asymmetric: a dip in the upper sideband but not in the lower; or the other way around, if the height of the ionosphere happens to be slightly different.
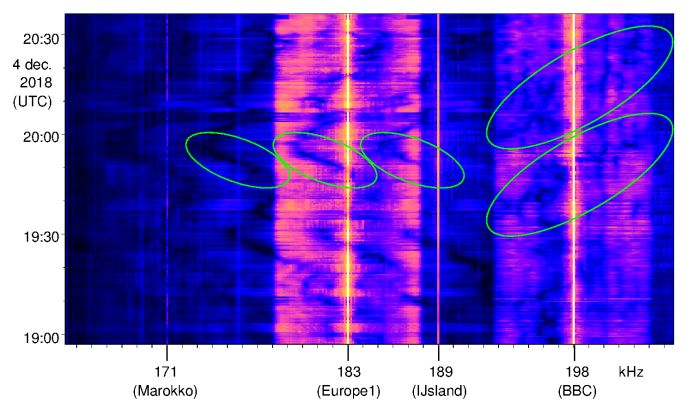 The next figure shows a waterfall diagram of the frequency range around 183 kHz during several hours.
We indeed see dips in the sidebands, which are not symmetric, and which drift randomly up and down
in time.
We also see that these dips repeat every 6 kHz or so.
Furthermore, this pattern isn't limited to frequencies between 178 and 188 kHz
(namely the desired 5 kHz wide sidebands on either side of the 183 kHz carrier),
but is also visible farther away from the carrier.
The "smudge" below 178 kHz, which would disturb reception of a 171 kHz transmitter,
must therefore also be coming from Europe1's transmitter.
It is not something that is generated locally in our receiver, because then the selective fading
pattern would not continue.
The next figure shows a waterfall diagram of the frequency range around 183 kHz during several hours.
We indeed see dips in the sidebands, which are not symmetric, and which drift randomly up and down
in time.
We also see that these dips repeat every 6 kHz or so.
Furthermore, this pattern isn't limited to frequencies between 178 and 188 kHz
(namely the desired 5 kHz wide sidebands on either side of the 183 kHz carrier),
but is also visible farther away from the carrier.
The "smudge" below 178 kHz, which would disturb reception of a 171 kHz transmitter,
must therefore also be coming from Europe1's transmitter.
It is not something that is generated locally in our receiver, because then the selective fading
pattern would not continue.
Looking carefully, we also see selective fading on 198 kHz, the BBC. But here the pattern is regular: the dip gradually moves up in frequency in about 20 minutes time. And just when it is about to leave the upper sideband at 203 kHz, a new dip enters the lower sideband at 193 kHz. Apparently, the dips are spaced 10 kHz here; and indeed, the path length difference from Droitwich to Twente between groundwave and skywave calculates to 0.1 ms.
 Selective fading also happens on mediumwave and shortwave, for the same reason:
multiple paths from transmitter to receiver.
At those higher frequencies, the groundwave usually is not important anymore, but then
multiple skywaves interfere, e.g. those bouncing back and forth one and two times between earth and ionosphere.
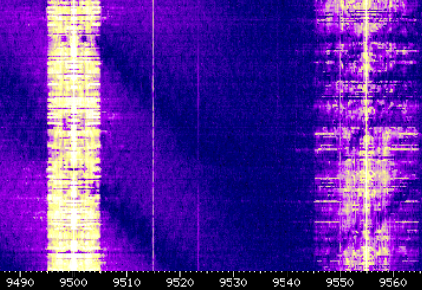
A more visible difference however is that the pattern changes much more quickly at these higher frequencies.
See the adjacent figure, which, in contrast to the previous figure, shows a time interval of only about 20 seconds.
We see diagonally moving fading dips both around 9500 kHz and around 9555 kHz.
This difference in speed is a consequence of the shorter wavelength.
If a change in the ionosphere causes the path length difference between both paths to increase by e.g. 10 meter,
then at 15 MHz this is already half a wavelength causing 180 degrees of phase difference;
but at 150 kHz it is only 0.005 wavelength, 2 degrees of phase, so hardly any effect.
So on longwave one has to wait much longer before a path length change has a noticeable influence on the
fading pattern.
Selective fading also happens on mediumwave and shortwave, for the same reason:
multiple paths from transmitter to receiver.
At those higher frequencies, the groundwave usually is not important anymore, but then
multiple skywaves interfere, e.g. those bouncing back and forth one and two times between earth and ionosphere.
A more visible difference however is that the pattern changes much more quickly at these higher frequencies.
See the adjacent figure, which, in contrast to the previous figure, shows a time interval of only about 20 seconds.
We see diagonally moving fading dips both around 9500 kHz and around 9555 kHz.
This difference in speed is a consequence of the shorter wavelength.
If a change in the ionosphere causes the path length difference between both paths to increase by e.g. 10 meter,
then at 15 MHz this is already half a wavelength causing 180 degrees of phase difference;
but at 150 kHz it is only 0.005 wavelength, 2 degrees of phase, so hardly any effect.
So on longwave one has to wait much longer before a path length change has a noticeable influence on the
fading pattern.
A time-domain view
In the above, we considered the effect of multipath propagation on the spectrum. But with suitable signals we can also see directly that a signal reaches our receiver multiple times with different delays. That is only possible if the signal itself has a very short duration: shorter than the delay difference of the paths. Otherwise, the signals from the different paths cannot be separated clearly, because they overlap.
A very suitable signal for this is the LORAN-C navigation system on 100 kHz. In this system transmitters at several locations periodically tranmit precisely timed short pulses. The receiver measures the times at which it receives the pulses from different transmitters, and calculates its position from that. Because of the required precision, this must be done based on the groundwave, because the skywave has taken a not so predictable detour via the ionosphere. That's why LORAN-C uses precisely defined short pulses. In North-West Europe, most LORAN transmitters were switched off at the end of 2015 (cf. [10]). Only one is still active, in Anthorn (about halfway between Manchester and Glasgow).
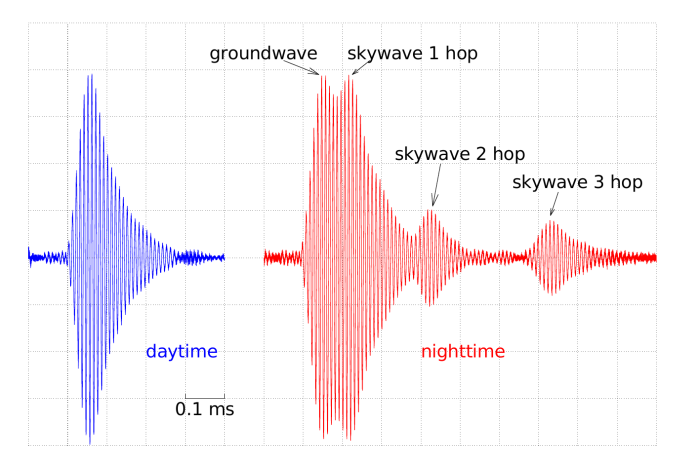 This figure shows the LORAN-C received from the Anthorn transmitter in Enschede.
The blue line was measured during daytime.
We see the 100 kHz carrier going from nothing to full amplitude in about 0.1 ms,
and after that decaying again to zero.
The increasing part has a precisely determined envelope.
If the amplitude would increase even faster, the signal would be too wide, like the key clicks of a bad CW transmitter.
During daytime, there is no skywave at this frequency, so the signal reaches us only once, via the groundwave.
This figure shows the LORAN-C received from the Anthorn transmitter in Enschede.
The blue line was measured during daytime.
We see the 100 kHz carrier going from nothing to full amplitude in about 0.1 ms,
and after that decaying again to zero.
The increasing part has a precisely determined envelope.
If the amplitude would increase even faster, the signal would be too wide, like the key clicks of a bad CW transmitter.
During daytime, there is no skywave at this frequency, so the signal reaches us only once, via the groundwave.
The red line was measured at night. We see the pulse arrive no less than four times, of which the first and second partially overlap. The first must be the groundwave, having the shortest path; the other pulses arrive about 65, 270 and 580 µs later, and must have been reflected back and forth between ionosphere and earth once, twice and three times, respectively. Calculating the delay of all of those paths between Anthorn and Enschede using the speed of light, we find 2.444 ms for the groundwave, and one, two and three reflections against the E layer at 90 km take 0.089, 0.295 and 0.606 ms longer, respectively. That fits the measured values quite well. (Strangely, all three are about 25 µs more than measured, which may either be a coincidence, or hint at an error in the measurement or calculation of the groundwave.)
Note that we now have considered the same phenomenon, namely reception of a signal via several paths with different delays, in both the frequency domain (selective fading) and in the time domain (several pulses received one after the other).
References:
[9] Technische notities van PA3FWM, Electron 10/2018. Not yet available online, but based on http://pa3fwm.nl/signals/luxembourgeffect/.
[10] http://pa3fwm.nl/signals/loran-2015/