Noise in FM reception
Pieter-Tjerk de Boer, PA3FWM web@pa3fwm.nl(This is an adapted version of an article I wrote for the Dutch amateur radio magazine Electron, September 2020.)
Did you ever notice that an FM receiver can produce three forms of noise, which sound differently? Starting with a strong unmodulated carrier and decreasing its amplitude, one first hears weak white noise which gradually gets louder; then tick-like sounds or "clicks" get added to that, more and more, until they together form a rattling sound; and finally, the clicks get together so much that the result again sounds like noise, but now more muffled (and much louder) than the white noise we started with. In this article we look at how this all happens.
The reason for me to dive into this was the WebSDR's FM demodulator. A user pointed out to me that it did not have a deemphasis filter. Indeed, I had forgotten to implement that, and that was easy to solve: just add a first-order low-pass filter. But then other WebSDR users complained that the FM now sounded "too muffled": well, that's a logical consequence of the low-pass filter. But then, how should it be? What's the "correct" sound for FM?
Measuring
 As I couldn't quite solve it theoretically, I decided to do some measurements
on a "real" FM receiver.
In this case it was a FuG10 / Teleport VII: a quarz-controlled handheld radio for police
etc., built in the 1970s with Deutsche Gründlichkeit, but by present standards too brick-like for portable use.
I bought mine in the 1990s at a radio fleamarket, added a PLL to it and built it into an enclosure
for use on 2 m at home.
As I couldn't quite solve it theoretically, I decided to do some measurements
on a "real" FM receiver.
In this case it was a FuG10 / Teleport VII: a quarz-controlled handheld radio for police
etc., built in the 1970s with Deutsche Gründlichkeit, but by present standards too brick-like for portable use.
I bought mine in the 1990s at a radio fleamarket, added a PLL to it and built it into an enclosure
for use on 2 m at home.
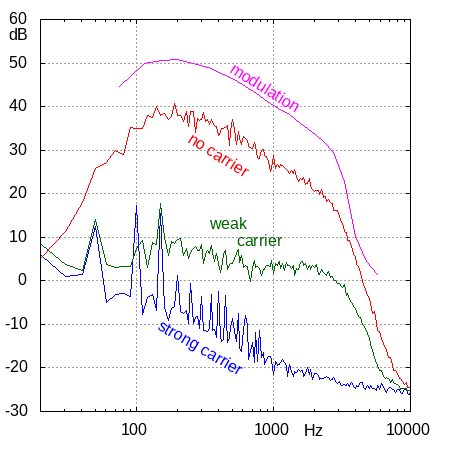
The adjacent figure shows the measurement results: the audio spectrum as measured at the loudspeaker output. Let's have a closer look at each of the lines.
Start with the pink line: this one is made by feeding the radio a signal from a generator, modulated in frequency with a sine wave of variable frequency but fixed deviation. We mostly see that despite the fixed deviation, the amplitude at the loudspeaker decreases with increasing frequency, at a rate of 20 dB per decade, at least between 300 and 3000 Hz, which is the range that's most important for voice. This decay is on purpose: it's the de-emphasis, which is (or should be) compensated for at the transmitter. Below 100 Hz and above 3400 Hz, the signal quickly diminishes: there are steep filters in the receiver to chop off these frequencies that are not so important for voice.
Next the red line: the output spectrum without input signal (but with the squelch opened manually), so effectively using pure noise at the input. We see that this spectrum is the same as that of a modulated signal with constant deviation.
Then the green line: the output spectrum with a weak unmodulated carrier. Here we see that this spectrum is approximately flat between 300 and 3400 Hz, as if there is no de-emphasis. Of course, the de-emphasis filter has not suddenly disappeared: we must conclude that with a weak unmodulated carrier, the noise from an FM demodulator has a different spectrum than with no input signal.
Finally the blue line, with a strong ("full quieting") unmodulated carrier.
We now see the noise floor of the receiver's demodulator and audio stages.
The peaks at multiples of 50 Hz of course are mains hum.
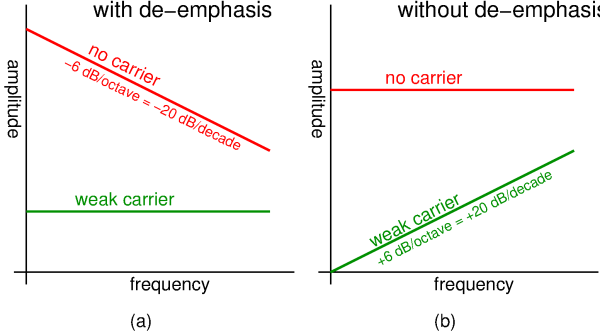
If we remove the extra filters that chop off the highest and lowest frequencies, what results is the idealised figure (a) shown here. If we also omit the de-emphasis filter, figure (b) remains. So, a pure FM demodulator, without filters and without de-emphasis, apparently produces a flat noise spectrum when there is no input carrier, and a "triangular" noise spectrum when there is a weak carrier.
Explanation of the noise spectra
Especially the difference between the spectrum without carrier (red line) and with a weak unmodulated carrier (green line) is notable. Of course, the noise with such a carrier is weaker than without carrier, but also it has relatively more high and less low frequency content. This difference has been known in science for a long time, and has been calculated theoretically already in the 1930s [1]. But it is also possible to understand the essence of it qualitatively, i.e., without formulas.
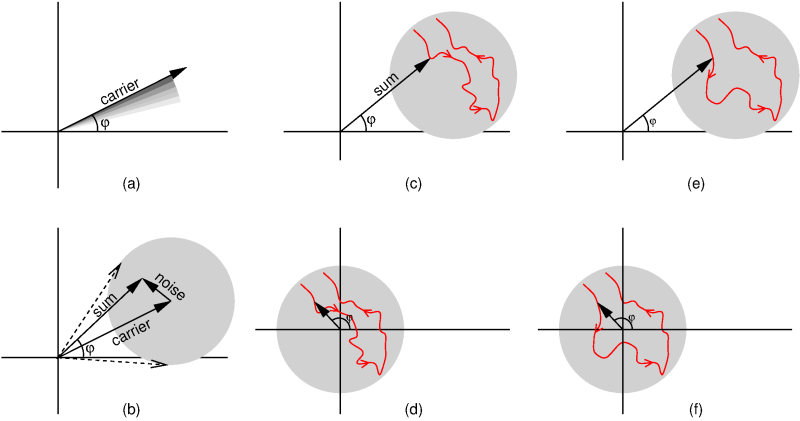 For that, we need diagrams like (a) shown here.
The arrow represents the received FM signal at some moment in time.
Its length is the amplitude, and its direction, i.e., the angle φ, is its instantaneous phase.
The arrow makes one rotation per period of the carrier, so e.g. 145 million rotations per second for a 145 MHz signal.
Frequence modulation then means that this rotation speed varies with the modulation.
For that, we need diagrams like (a) shown here.
The arrow represents the received FM signal at some moment in time.
Its length is the amplitude, and its direction, i.e., the angle φ, is its instantaneous phase.
The arrow makes one rotation per period of the carrier, so e.g. 145 million rotations per second for a 145 MHz signal.
Frequence modulation then means that this rotation speed varies with the modulation.
(The horizontal and vertical axes in this diagram can be interpreted as the quadrature signals (I and Q) that are often used in SDR, but that is not important now.)
145 million rotations per second is dizzying. Therefore, we prefer to pretend that the signal is not at 145 MHz, but at 0 Hz. Then the arrow is stationary in the absence of modulation, and rotates counter-clockwise (positive frequency) or clockwise (negative frequency) when the modulating signal is positive or negative, respectively.
If the signal is received with some noise, that noise must be added to the received signal. This is done in figure (b): we again see the carrier, and we see a second arrow representing the noise, and a third arrow representing their sum. This sum-arrow is what reaches the FM demodulator: the FM demodulator will thus try to find out how this arrow is rotating, in order to decide what voltage to send to the loudspeaker.
As noted above, the added arrow is noise, so this moves around randomly. The grey circle indicates where the sum of the carrier and the noise can end up. Its radius is the (presumed) maximum amplitude of the noise. The dashed arrows indicate the most extreme valus that φ can assume.
Figure (c) shows a possible "realisation" of the noise: the red line is the path taken by the sum of the carrier and the noise. Viewed from the origin, we first see a clockwise rotation, followed by a counter-clockwise rotation. Or, slightly more mathematically: φ first decreases and then increases. Or: first the frequency is a bit lower than the carrier frequency, and then a bit higher. Or: first the FM demodulator's output voltage is negative, then positive.
We haven't said yet how quickly we move along the red path. Suppose the entire red path is gone through in 1 ms, then the result can be seen as a noise contribution of 1 period in 1 ms, i.e., 1000 Hz. But if it takes 10 ms to follow the entire red path, it's a noise contribution of 100 Hz. But in the latter case, the speed at which φ changes, and thus the "deviation" that the FM demodulator sees, is 10 times smaller. So, we see that for a given amplitude of the noise (and thus a give radius of the grey circle), the noise contributions at lower audiofrequencies have a smaller deviation. And that's exactly what we already saw in the earlier figure: when there's a weak carrier, the noise coming out of the FM demodulator is less strong at lower frequencies.
How does this change when there's no carrier? See figure (d). We see the same red path representing the noise, but now it goes around the origin because there's no carrier anymore to be added to it. If we now study how φ changes when moving along this path, we effectively see the same as before, first a decrease and then an increase of φ. However, we also see that the change of φ is now larger, and thus faster, representing a larger FM deviation, so louder noise at the demodulator output.
Next, look at figures (e) and (f), showing a different but still random noise path, in (e) with and in (f) without carrier. With carrier in figure (e), the situation is not really different than in the earlier with-carrier example of figure (c). But without carrier, figure (f), the situation changes fundamentally: seen from the origin, the signal no longer moves back and forth, but it only moves "forth", counter-clockwise in this example. In other words, φ is now only increasing, the frequency is above that of the unmodulated carrier all the time, so the FM demodulator's output voltage is positive al the time. We thus see that the same noise without carrier now results in something very different than with carrier.
The background of this difference is that the noise without carrrier can go around the origin one or more times, and thus φ can continue increasing (or decreasing, for a clockwise rotation), while with carrier φ can only move back and forth a bit. This limitation of how φ can change was the basis for our earlier explanation for the reduced low frequency content. Thus, we see how the noise spectrum without carrier, and thus without limitation on φ, can be different, namely flat as in the earlier figure.
Clicks
 So, we get fundamentally different spectra without carrier and with a weak carrier.
But where's the threshold? How much carrier do we need to go from one to the other?
There is no precise threshold: it's a gradual transition.
That transition is marked by clicks in the audio.
So, we get fundamentally different spectra without carrier and with a weak carrier.
But where's the threshold? How much carrier do we need to go from one to the other?
There is no precise threshold: it's a gradual transition.
That transition is marked by clicks in the audio.
If we start with an unmodulated carrier and make it gradually weaker, at first the strength of the output noise will increase without changing the spectrum. But occasionally clicks are heard, more frequenctly as the carrier becomes weaker, and eventually they are so numerous that together they form the other noise spectrum, the one corresponding to the absence of carrier.
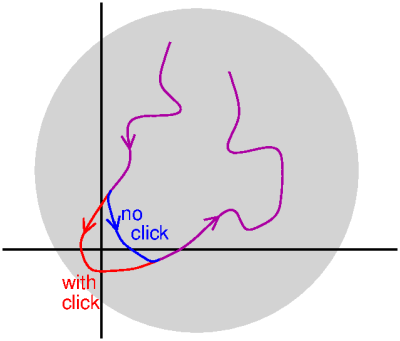
To understand where the clicks come from, have a look at this diagram, which shows the situation for a very weak carrier. The carrier is so weak, that it is about as strong as the noise. So most of the time, the noise arrow is shorter that the carrier arrow, but occasionally it is a bit longer. When the noise arrow is longer than the carrier arrow, and happens to point in the exact opposite direction, the sum arrow can quickly make turn around the origin: the red line in the figure. If the noise arrow is a bit shorter, than this doesn't happen: the blue line. Such a quick turn around the origin gives a click in the audio, because from the point of view of the FM demodulator it seems as if the instantaneous frequency is rather high: in a short time the sum arrow (not drawn here) almost completely rotates counter-clockwise around the origin. As the carrier is weaker compared to the noise, this happens more often, so there are more clicks.
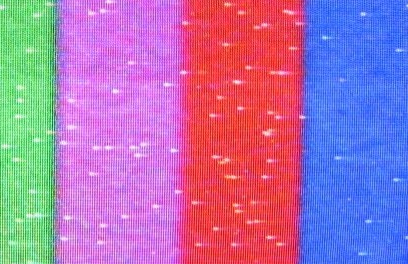 Those clicks are not just audible.
If FM is use for an (analog) television signal, as used to be done for satellite television,
and is still used for amateur television, such a click leads to a characteristic white speck
in the picture, as shown here (zoomed in on a picture from [2]).
Those clicks are not just audible.
If FM is use for an (analog) television signal, as used to be done for satellite television,
and is still used for amateur television, such a click leads to a characteristic white speck
in the picture, as shown here (zoomed in on a picture from [2]).
Furthermore, the clicks become worse when the carrier is not in the center of the filter, so when the carrier is modulated. This also makes sense. When the carrier is modulated, the carrier arrow is rotating clockwise or counter-clockwise, so the grey circle as a whole is rotating around the origin. This extra rotation can just make the difference for whether a brief peak of the noise will go around the origin or not, and thus will or will not make a click. One can also notice this in practice. Listen to a weak FM signal. During breaks in the (speech) modulation there is less noise (mostly consisting of these clicks) then when there is modulation.
The capture effect
What happens if our reception is not disturbed by pure noise, but by another transmitter, which is received weaker than the desired one? We again get the situation of figure (b), but now the grey circle is not the noise but the signal of the disturbing transmiter. We again see that the phase φ can only deviate a limited amount, as indicated by the dashed arrows. At the same time, φ can go back and forth a lot due to the modulation of the desired signal, possibly many rotations if the deviation (modulation index) is made large. Thus, the influence of the disturbing transmitter becomes smaller relative to that of the desired signal, as the modulation index is increased. This is known as the "capture effect": when receiving two FM stations simultaneously, one mostly hears the strongest of them; the influence of the weaker one is relatively limited.References:
[1] Murray Crosby: Frequency modulation noise characteristics, Proceedings of the IEE, 1937.
[2] https://www.rigpix.com/atvstockholm/atvstockholm.htm